Evaluation Metrics, ROC-Curves and imbalanced datasets
I wrote this blog post with the intention to review and compare some evaluation metrics typically used for classification tasks, and how they should be used depending on the dataset. I also show how one can tune the probability thresholds for particular metrics.
You can find the complete code associated with this blog post on this repository:
Introduction
When making a prediction for a two-class classification problem, the following types of errors can be made by a classifier:
- False Positive (FP): predict an event when there was no event.
- False Negative (FN): predict no event when in fact there was an event.
- True Positive (TP): predict an event when there was an event.
- True Negative (TN): predict no event when in fact there was no event.
Accuracy
Accuracy simply measures the number of correctly predicted samples over the total number of samples. For instance, if the classifier is 90% correct, it means that out of 100 instances it correctly predicts the class for 90 of them.
\[\textrm{accuracy} = \frac{\textrm{nr. correct predictions}}{\textrm{nr. total predictions}} = \frac{\textrm{TP+TN}}{\textrm{TP+TN+FP+FN}}\]This can be misleading if the number of samples per class in your problem is unbalanced. Having a dataset with two classes only, where the first class is 90% of the data, and the second completes the remaining 10%. If the classifier predicts every sample as belonging to the first class, the accuracy reported will be 90% but this classifier is in practice useless.
With imbalanced classes, it’s easy to get a high accuracy without actually making useful predictions. So, accuracy as an evaluation metric makes sense only if the class labels are uniformly distributed.
Precision and Recall
Precision and Recall are two metrics computed for each class. They can be easily explained through an example, imagine that we want to evaluate how well a robot selects good apples from rotten apples There are \(m\) good apples and \(n\) rotten apples in a basket. A robot looks into the basket and picks out all the good apples, leaving the rotten apples behind, but is not perfect and could sometimes mistake a rotten apple for a good apple orange.
When the robot finishes, regarding the good apples, precision and recall means:
- Precision: number of good apples picked out of all the apples picked out;
- Recall: number of good apples picked out of all the good apples in the basket;
Precision is about exactness, classifying only one instance correctly yields 100% precision, but a very low recall, it tells us how well the system identifies samples from a given class.
Recall is about the completeness, classifying all instances as positive yields 100% recall, but very low precision, it tells how well the system does at identifying all the samples from a given class.
We will see further ahead how to get the best out of these two metrics, using Precision-Recall curves.
Typically these two metrics are combined together in a metric called \(F_{1}\) (i.e., the harmonic mean of precision and recall), which eases the comparison of different systems, and problems with many classes. They are defined as:
\[\textrm{Precision} = \frac{\textrm{TP}}{\textrm{TP+FP}}\] \[\textrm{Recall} = \frac{\textrm{TP}}{\textrm{TP+FN}}\] \[F_{1} = 2 \times\frac{\textrm{Precision} \times \textrm{Recall}}{\textrm{Precision} + \textrm{Recall}}\]Note that you need to measure this for every possible class in your dataset. So, Precision and Recall metrics are appropriate when you are dealing with imbalanced classes.
Sensitivity and Specificity
These two metrics are somehow related to Precision and Recall, and although not often, I saw them being used a couple of times in NLP-related problems:
\[\textrm{Sensitivity} = \frac{\textrm{TP}}{\textrm{TP+FN}}\] \[\textrm{Specificity} = \frac{\textrm{TN}}{\textrm{TN+FP}}\]Sensitivity: is the same as recall, defined above, can be seen as the extent to which actual positives are not overlooked, so false negatives are few.
Specificity: also called the true negative rate, measures the proportion of actual negatives that are correctly identified as such, i.e., is the extent to which actual negatives are classified as such (so false positives are few).
Sensitivity therefore quantifies the avoiding of false negatives, and specificity does the same for false positives.
There some scenarios where focusing on one of these two might be important, e.g:
- Sensitivity: the percentage of sick people who are correctly identified as having the condition.
- Specificity: the percentage of healthy people who are correctly identified as not having the condition.
Receiver Operating Characteristic (ROC) Curves
While defining the metrics above, I assumed that we are directly given the predictions of each class. But it might be the case that we have the probability for each class instead, which then allows calibrating the threshold on how to interpret the probabilities. Does it belong to the positive class if it’s greater than 0.5 or 0.3?
The curve is a plot of the false positive rate (x-axis) versus the true positive rate (y-axis) for a number of different candidate threshold values between 0.0 and 1.0. An operator may plot the ROC curve and choose a threshold that gives a desirable balance between false positives and false negatives.
- x-axis: the false positive rate is also referred to as the inverted specificity where specificity is the total number of true negatives divided by the sum of the number of true negatives and false positives.
- y-axis: the true positive rate is calculated as the number of true positives divided by the sum of the number of true positives and the number of false negatives. It describes how good the model is at predicting the positive class when the actual outcome is positive.
NOTE: remember that both the False Positive Rate and the True Positive Rate are calculated for different probability thresholds.
Precision-Recall Curve
As shown before when one has imbalanced classes, precision and recall are better metrics than accuracy, in the same way, for imbalanced classes a Precision-Recall curve is more suitable than a ROC curve.
A Precision-Recall curve is a plot of the Precision (y-axis) and the Recall (x-axis) for different thresholds, much like the ROC curve. Note that in computing precision and recall there is never a use of the true negatives, these measures only consider correct predictions
Pratical Example
Let’s first generate a 2-class imbalanced dataset
X, y = make_classification(n_samples=10000, n_classes=2, weights=[0.95,0.05], random_state=42)
trainX, testX, trainy, testy = train_test_split(X, y, test_size=0.2, random_state=2)
Train a model for classification
model = LogisticRegression()
model.fit(trainX, trainy)
predictions = model.predict(testX)
Comparing the Accuracy vs. Precision-Recall with imbalanced data
accuracy = accuracy_score(testy, predictions)
print('Accuracy: %.3f' % accuracy)
Accuracy: 0.957
print(classification_report(testy, predictions))
             precision    recall  f1-score   support

          0       0.96      0.99      0.98      1884
          1       0.73      0.41      0.53       116

avg / total       0.95      0.96      0.95      2000
ROC Curve vs. Precision-Recall Curve with imbalenced data
probs = model.predict_proba(testX)
probs = probs[:, 1]
fpr, tpr, thresholds = roc_curve(testy, probs)
pyplot.plot([0, 1], [0, 1], linestyle='--')
pyplot.plot(fpr, tpr, marker='.')
pyplot.show()
auc_score = roc_auc_score(testy, probs)
print('AUC: %.3f' % auc_score)
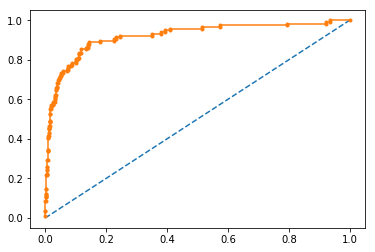
AUC: 0.920
Precision-Recall curve
precision, recall, thresholds = precision_recall_curve(testy, probs)
auc_score = auc(recall, precision)
pyplot.plot([0, 1], [0.5, 0.5], linestyle='--')
pyplot.plot(recall, precision, marker='.')
pyplot.show()
print('AUC: %.3f' % auc_score)
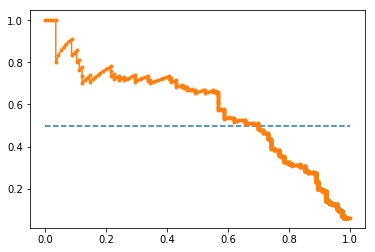
AUC: 0.577
Summary
If you have an imbalanced dataset accuracy can give you false assumptions regarding the classifier’s performance, so it’s better to rely on precision and recall, in the same way, a Precision-Recall curve is better to calibrate the probability threshold in an imbalanced class scenario as a ROC curve.
-
ROC Curves: summarise the trade-off between the true positive rate and false positive rate for a predictive model using different probability thresholds.
-
Precision-Recall curves: summarise the trade-off between the true positive rate and the positive predictive value for a predictive model using different probability thresholds.
ROC curves are appropriate when the observations are balanced between each class, whereas precision-recall curves are appropriate for imbalanced datasets. In both cases, the area under the curve (AUC) can be used as a summary of the model performance.
| Metric | Formula | Description |
|---|---|---|
| Accuracy | $$\frac{\textrm{TP+TN}}{\textrm{TP+TN+FP+FN}}$$ | Overall performance of model |
| Precision | $$\frac{\textrm{TP}}{\textrm{TP+FP}}$$ | How accurate the positive predictions are |
| Recall/Sensitivity | $$\frac{\textrm{TP}}{\textrm{TP+FN}}$$ | Coverage of actual positive sample |
| Specificity | $$\frac{\textrm{TN}}{\textrm{TN+FP}}$$ | Coverage of actual negative sample |
| F1-score | $$2 \times\frac{\textrm{Precision} \times \textrm{Recall}}{\textrm{Precision} + \textrm{Recall}}$$ | Harmonic mean of Precision and Recall |
References
evaluation_metrics imbalanced_data classification 